Perspective Flow

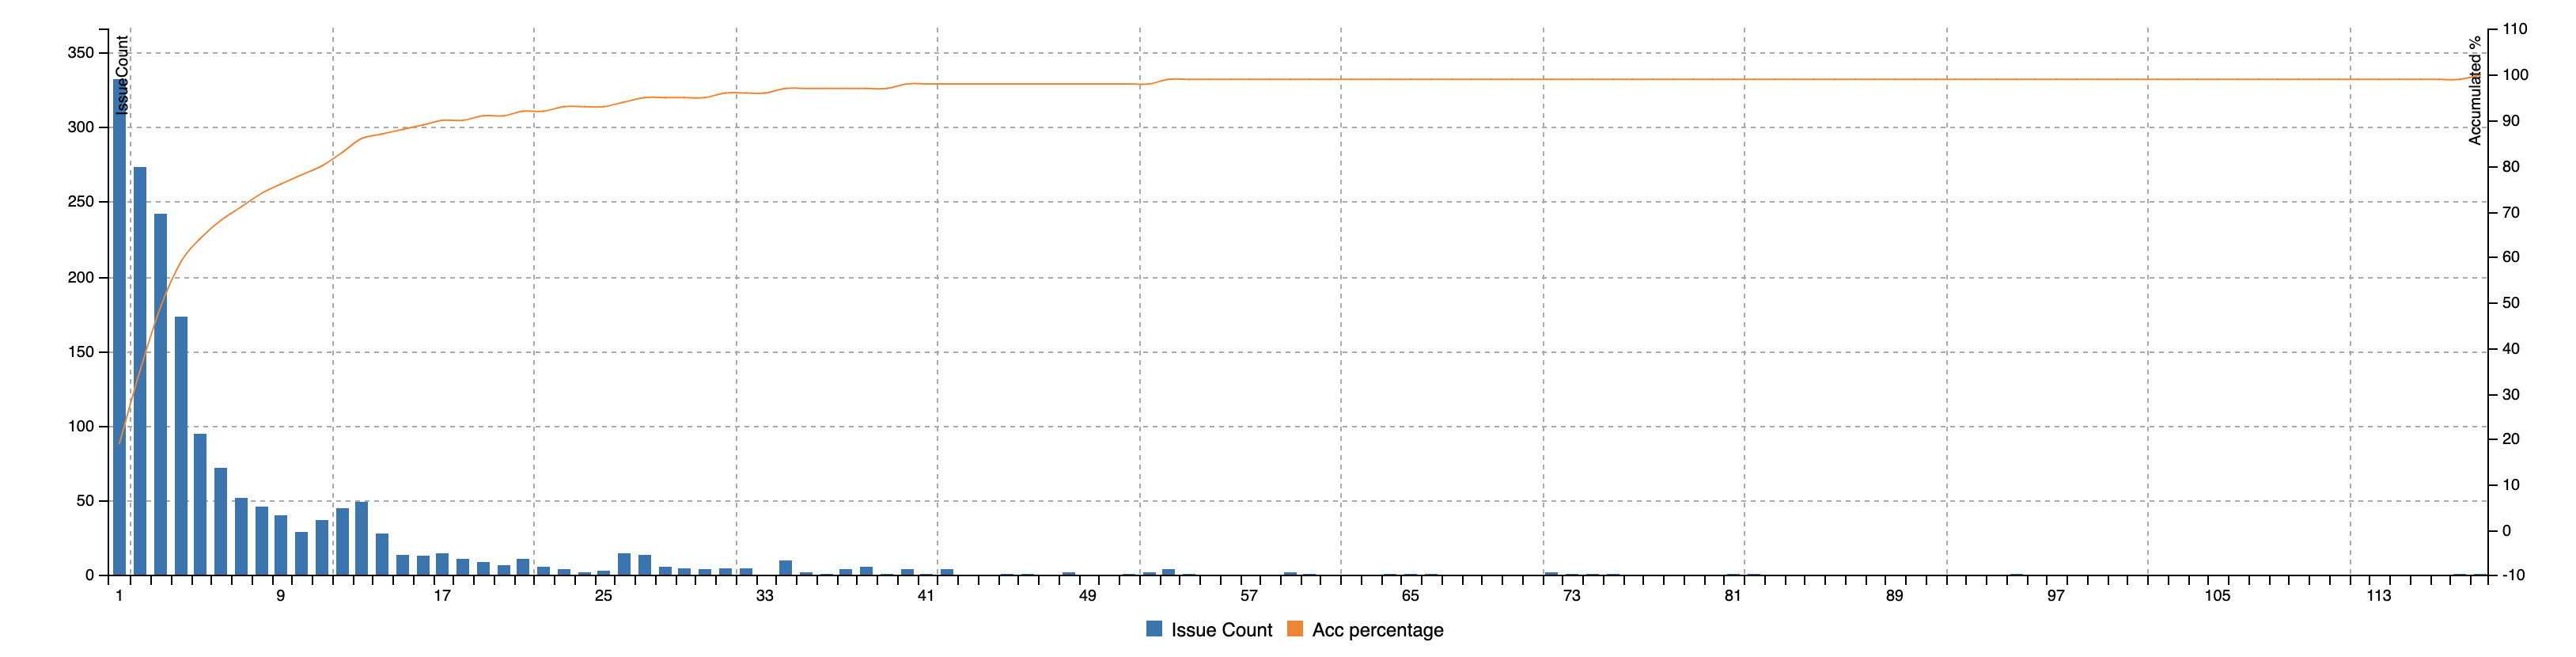
The flow perspective provides different views of our capacity by visualizing the flow in terms of CFD, Throughput and lead times.

Cumulative Flow Diagram

This view visualizes

  • Number of issues in each state over time
  • Hover for a view of specific number of issues a specific date
  • Growing width indicates Bottleneck
  • De-select Done to get a burndown view
  • Select active states to get WIP
  • Slope shows throughput
Feature Image

Iteration Report

This view visualizes

  • List of all issues closed in the iteration
  • Select start state to get cycle time
  • Empty cycle time for issues drawn directly to done
Feature Image

Lead Time

This view visualizes

  • Lead time, shows the distribution of lead times for closed issues
  • Cycle time by selecting a start state
  • First bar is for zero lead/cycle time (drawn directly to done)
  • Ticket age shows a distribution of how old open issues are
  • Selecting a start state shows time since open issue first appeared in state
Feature Image

Throughput

This view visualizes

  • Throughput shows the number of closed issues in each timeframe
  • Inflow shows the number of issues created in each timeframe
  • Backlog growth shows the difference between throughput and inflow
  • Lines show Accumulated Average and Rolling Average
Feature Image

Empower your teams with data-driven clarity.

Scope360° delivers actionable insights for strategic planning, delivery flow, and reliable forecasts — seamlessly integrated with Jira.

Start 30 Days Free Trial

Cta Image Cta Image
Cta Image Cta Image