
View - Cumulative Flow Diagram
Part of Flow Perspective
Views
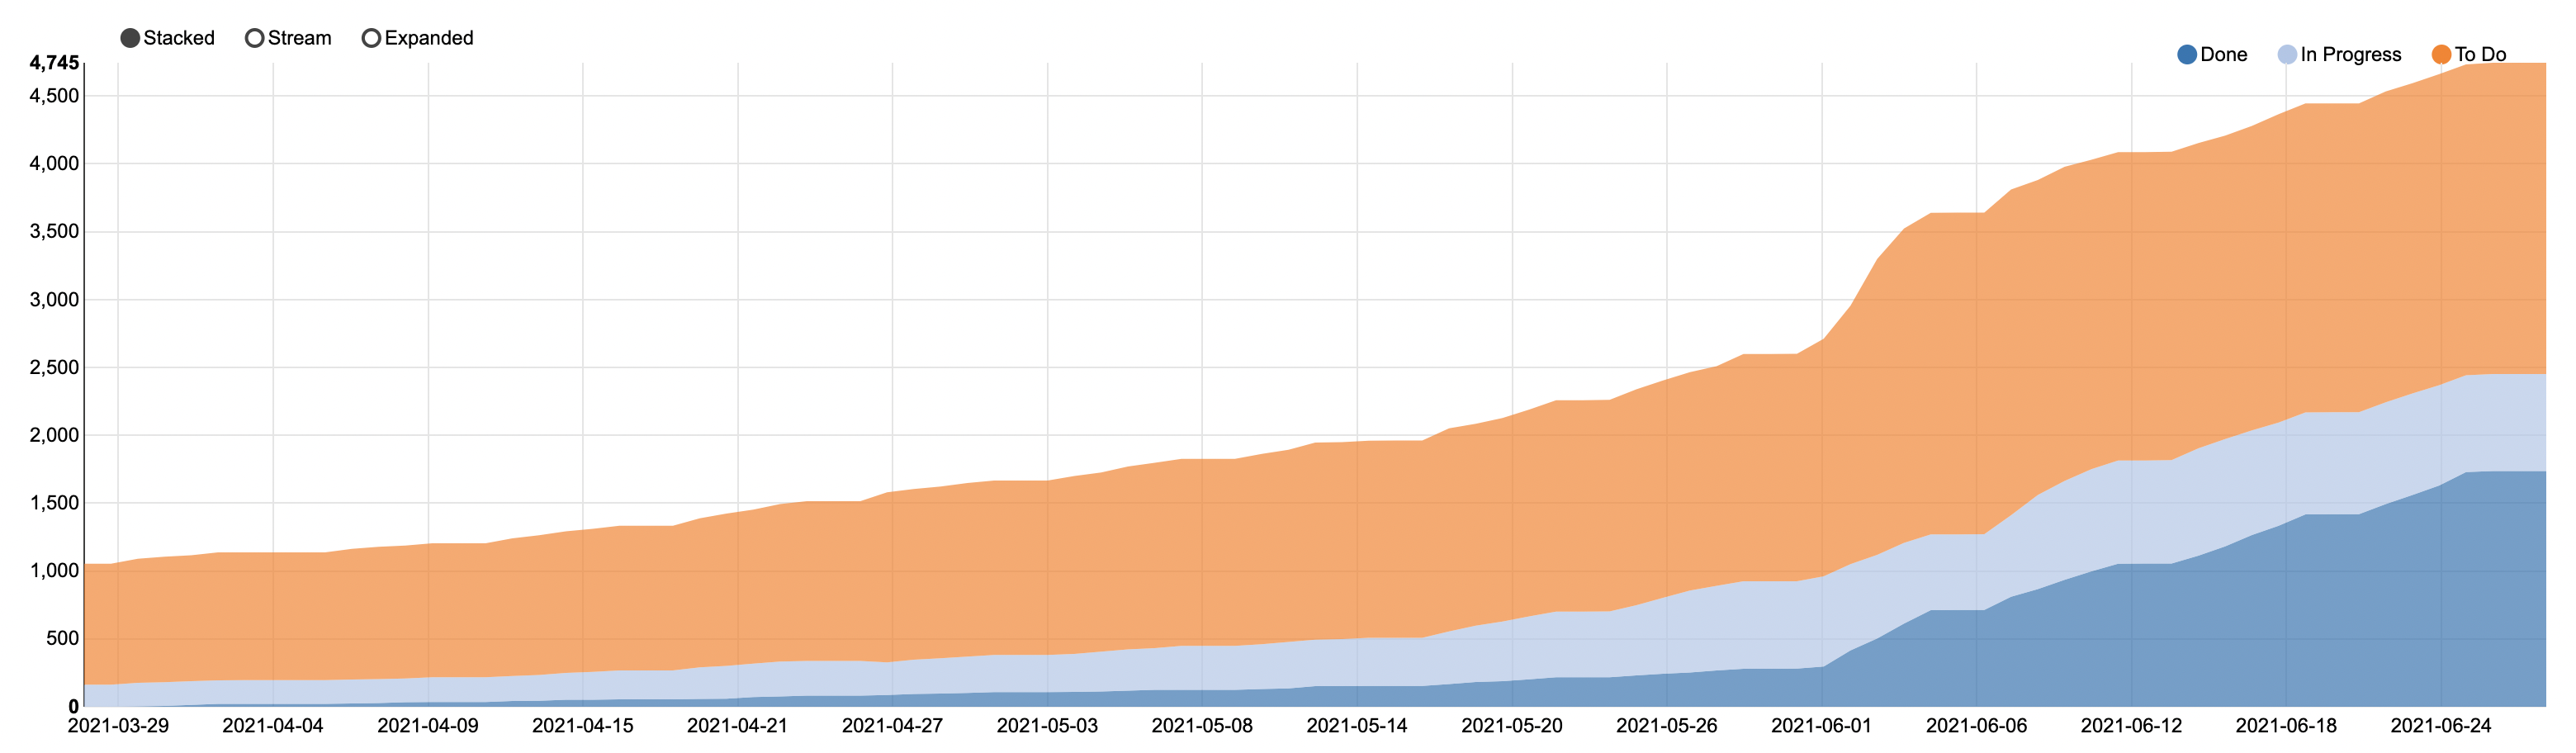
This view visualizes
- Number of issues in each state over time
- Hover for a view of specific number of issues a specific date
- Growing width indicates Bottleneck
- De-select Done to get a burndown view
- Select active states to get WIP
- Slope shows throughput