
View - Throughput
Part of Flow Perspective
Views
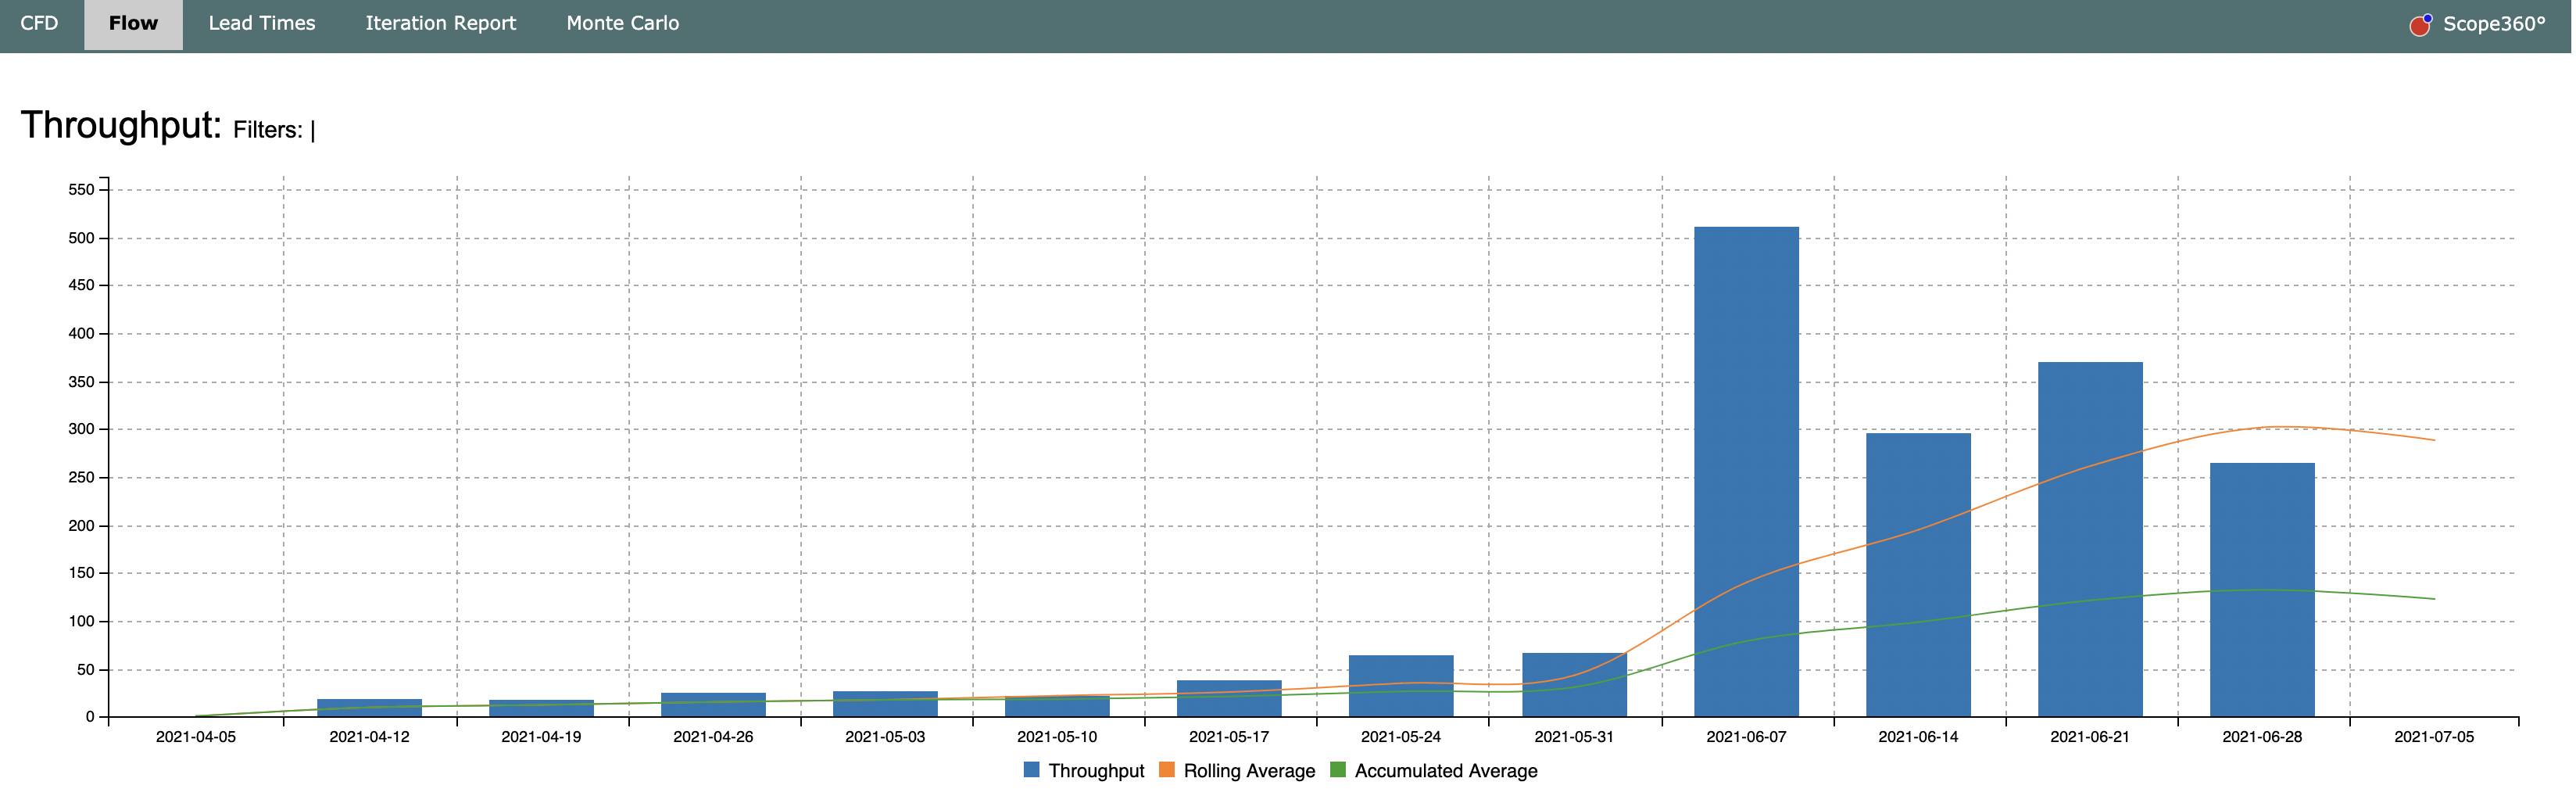
This view visualizes
- Throughput shows the number of closed issues in each timeframe
- Inflow shows the number of issues created in each timeframe
- Backlog growth shows the difference between throughput and inflow
- Lines show Accumulated Average and Rolling Average